Enlarge to see full graphic
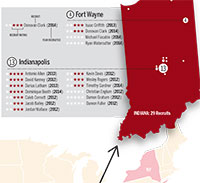
For my map project, I decided to dissect IU football head coach Kevin Wilson’s recruiting trends across the United States. Wilson has struggled in the Big Ten conference during his time at IU, so I thought it would be interesting to see if it has anything to do with where he recruits his players.
He took over the football team in 2011, immediately beginning recruiting for the 2012 class. For this project I compiled his recruiting classes from 2012 to his latest in 2015, using the database on 247sports. During my research I found he gets most players in-state, but also recruits heavily in Georgia and Florida.
When I was growing up, I was obsessed with recruiting players in the NCAA Football video games. The game would highlight the states where you get the most recruits for your team, so I used that as inspiration. The term “pipeline” is used in this game and among college football analysts to describe where a university gets its players, and I decided to keep this in mind while working on my map project.
One of the hardest things to sort out was players recruited out of junior college. Four players were from junior colleges in Iowa, but I ended up finding where these JUCOs were originally went to high school. I also had to cross-reference with the final team rosters at IU Athletics to make sure Wilson’s recruits made it to school. Some players never reported to camp due to academic or personal reasons, so I omitted them from the final data set.
By the end of this project, I learned the importance of distinct-but-related color schemes. It was challenging to figure out what shades of red to color the states based on the number of recruits. But after it was all said and done, this project ended up being fun to work on.