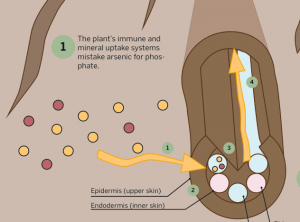
I had a lot of fun making this diagram, and I think this time I picked a topic I could conquer in the time I was given to finish the graphic.
I find the subject of toxin contamination of soils and water to be very interesting, and I’ve learned more about it this year than ever before (through this class, a plant physiology class, and an inorganic chemistry class). Toxins in soil can have a massive impact on health. In areas where contamination is a major health issue, toxins can contribute to political and socioeconomic injustice. In areas where it is a minor issue, people still have reason to be concerned about it- metals in the body are no joke, and while some of them are necessary for life (Fe, Zn, Mg, etc.) others are very, very bad.
I am curious about how these bad metals get into our bodies – through water, air, skin contact, and food. This project tackles the food issue.
I chose arsenic because it is a fairly evocative toxin. People recognize the name and respond to it pretty strongly, so I thought it would have some news value. And I decided using an unambiguously bad element was a good idea. There are plenty of metals that are good in low doses but bad if the dose is too high- but I decided getting into that kind of detail would be too complicated for my diagram. That was a good choice.
I am happy with the overall look and layout of the diagram. If I made changes, I would shrink the soil and expand the sky just enough to put up a small map showing Bangladesh, or a small chart showing a) amounts of arsenic in agricultural crops (on the left of the stem) and another small chart showing b) the number of human deaths/year due to arsenic, or the number of people exposed to unhealthy levels of arsenic every year, by country (to the right of the stem).
I also would like to make the cutaway diagram more realistic and 3D-looking. I think it gets the point across, but it looks a bit chunky and amateurish.
I’m digging the roots, though.
The cutaway diagram doesn’t include all the parts of the root structure, but it does include the parts relevant for understanding how arsenic gets into the plant and travels through it, which is the point of the diagram.
I’d like to get into more detail about the actual mechanism of transport of arsenic through the plant. Like what exactly ferries it around? Some sort of protein or enzyme, or is it just dissolved in the water?
I did make a chart of the number of people exposed to unhealthy levels of arsenic every year, by country, but the numbers are just so astronomically different from one another that I decided to leave it out. It appears that arsenic poisoning is not really a worldwide issue; most countries do not have very high levels of As in the water and soil. Certain countries, however, do. Bangladesh has it worst, followed by Mongolia and Thailand. The numbers of people exposed were 30,000,000 in Bangladesh, 300,000 in Inner Mongolia, 2,000 in Thailand, and 300 in U.S.A. These numbers were just so widely different that I didn’t think a chart was that informative (even though I really really wanted to put it in).
For your interest, there is a curious reason Bangladesh’s numbers are so enormous. In the 1970s, humanitarian efforts were made to improve the water quality in Bangladesh, which at the time was suffering from a lot of water-borne infectious disease (due to pathogens). So relief organizations came in an helped dig a bunch of wells, all to more or less the same depth. Unfortunately, there happened to be a very high concentration of arsenic present at that depth- it is just a feature of the geology of the area. So all the water that comes from these wells has way too much arsenic in it, and the Bangladeshi people are continually poisoned by it.
So that is a problem.
One solution is to dig the wells deeper, so that they pass this arsenic layer. That will take lots of time, money, and labor, but it will help with the problem.
That’s my knowledge on the topic, I will read more about it and get a better understanding of what’s happening with that situation.
I really wanted to go more in depth with the specific effects of arsenic, biochemically, in both plants and in animals. I think that would be interesting, to talk about why it is so bad for humans. I was glad to explore the plant side of things, though, because a) plants are cool and don’t get enough attention or credit and b) it’s important to understand plant physiology if I want to understand how eating the plants affects human health. Know thyself, know thy food.
Feedback is appreciated, I am interested in pursuing this project further as well as applying a similar template to other toxins.


