Click on the image for a PDF version of my graphic!
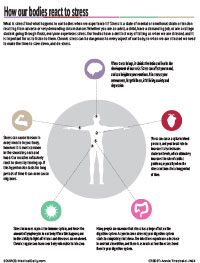
While I was trying to come up with some sort of process the I could visually represent, I couldn’t help but think to myself, how stressed I was. After a couple of days of contemplating ideas, it finally hit me. I decided to do an annotated and process diagram of how stress affects the body. I narrowed it down to the five major systems or areas that become compromised when the body undergoes stress. I started with the brain, then heart, the digestive system, the immune system, and finally the muscles. In each step I explain how this part of the body is effected by stress.
Personally, I found the idea of creating icons to be the most fun when it came to the diagram project. I could have done a cutaway version of the body explaining what happens inside the body when stress occurs, however I loved the idea of creating my own depictions of the body parts and adding a little but of design and color to them. I wanted to create a graphic that was clear, concise, easy to follow, and somewhat modern and simplistic.