The life cycle of a butterfly

Click on the image for a PDF version of my graphic

Click on the image for a PDF version of my graphic

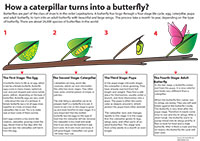
My topic is about how a caterpillar turns into a beautiful butterfly. A butterfly has to go through a four-stage life cycle to turn into an adult beautiful. It starts its life as a butterfly egg and hatch from the egg as a caterpillar. Then, the caterpillar forms itself into a pupa for weeks and finally comes out the pupa as a beautiful butterfly. The life cycle is long and complicated. Therefore, I decided to create a process diagram to show those four stages respectively. My goal is to make the diagram clear and easy to read that all people, even kids can understand.

I got my information and data from The Butterfly Site, the number one butterflies information source. The biggest challenging was that I had to look at a lot of pictures to see how butterfly eggs, caterpillars, and pupa look like. I don’t like to see butterfly eggs and caterpillars normally. But I know I have to see them very carefully in order to draw an accurate graphic.

Usually when people draw a diagram about life cycle, they like to use the circle life cycle template. But I want to try something new. I noticed that all those four stages happen on branch. Therefore I decided to draw a long branch and the four stages respectively on the branch. I draw a description box under each stage and connect the images and boxes with arrows.

As for color, I tried to choose color that reflect the way objects look – green for leaves, brown for branch, and colorful color for butterfly, etc. What’s more, I applied gradient on them to make them look more vivid.

All in all, I am happy with how my diagram turned out. I think it meets my goal – clear and easy to understand, and I am satisfied with it.

Attractions people love most in Yellowstone National Park

Map chart of top attractions in Yellowstone National Park

Click on the image for a PDF version of my graphic

Yellowstone National Park is one of the most famous parks in the world. It attracts thousands of people to visit every year. However, there are so many attractions in the park that many people have no idea which one to visit. My goal for this project is to create a map chart that can clearly tell people what top ten attractions are and where they located in the park.

It took me some time to look for data. There are so many different data of what the top ten attractions are. However, I decided to use the data from Yellowstone Net, one of the most authorized websites for Yellowstone National Park.

There are many map graphs for Yellowstone National Park already. However, most of them are too complicated and hard to read. Therefore I decided make a map that only includes important elements of the park and make it easy to understand. I chose blue color for lakes and brown color for land of the park in order to match people’s common perception of how they look. I tried white color for roads first but it did not show very well on my light brown color land. Therefore I changed the color of roads to yellow. I followed our J464 style guide to use Myriad Pro and BentonSansCond Bold* because I think they look very nice on my design.

As for the composition, I wanted to place five images of attractions on the left side and the other five on the right side – just as how people normally do.
However, I realized that there is an insert map that takes quite a lot of space on the right side of the page. Therefore I decided to place four images on the left side, and the other six images on the right side with two columns in order to balance the height of two sides.

I learned a lot from the project. I am much more comfortable with using Illustrator and pen tool now. And I am more proficient with making scale. Overall, I am satisfied with my design. But there are still some things that I want to do but I did not know how to do it, such as creating texture. I believe that I can make it nicer after I learn more about Illustrator.