Diagram: Deforestation in Haiti

Click image to view full pdf of diagram.

Click image to view full pdf of diagram.

For my final diagram, I wanted to continue to build upon the knowledge I had built up about deforestation in Haiti from my first chart project. It was easier in this case to compile data and information because I checked out several books on deforestation in Haiti. It was pretty difficult finding raw data on deforestation in Haiti for the chart project, but working with the process was easier to find information on. I found a very in-depth report on rural poverty and environmental degradation in Haiti.

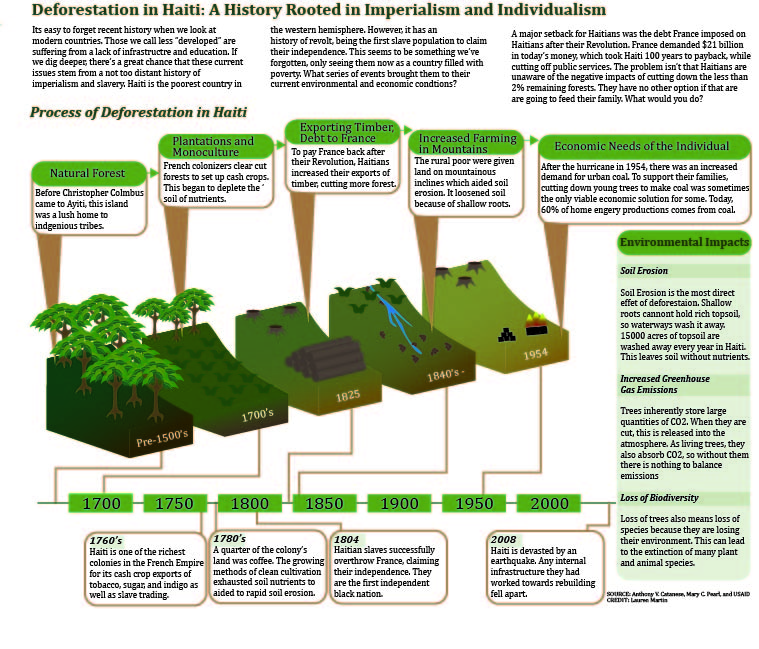
Since deforestation in Haiti is a complex issue, with interwoven political, social, and environmental aspects through history contributing to this top issue in Haiti I had a hard time trying to visually lay out all of these reasons. In news articles, I feel like the depth of why deforestation is plaguing the country has been overlooked, or barely touched upon. They tend to blame current generations for outrightly destroying the land, when in fact its much more of a build up of centuries of misuse of the environment from non-Haitians. Current Haitians are trying to clean up the mess more “developed” countries have left behind.

I started to web out my ideas to see the connections I was making. I started to realize how connected these events were on a timeline basis. I was able to hone in on this history of the country since its French colony days to the stem of deforestation. This is a point that most news sources don’t get into when they talk about the rampant poverty and degradation. The debt that France imposed on the Haitians after their revolution is also rarely mentioned, but a large part of why they began to export so much of their timber, because they had no other choice or face loosing their newly gained freedom.

From this point, I was able to create a web that connected these events, but I wasn’t sure how I wanted to communicate it visually. I tried creating my idea first on Illustrator, but Steve saw this was a bad idea because of my lost frustration. He suggested I sketch out my ideas, so I went through three drafts until I got to my final image which you can see. I started with separate 2d steps showing the land, then one connected 3d land mass that was divided by lines, than actually dividing up the sections to show a clear distinction. I used gradients to show the loss in green life and soil quality over time. I used a sloped surface because Haiti is very mountainous, which increases negative impacts like soil erosion more quickly.

The timeline was easily integrated, and also helpful to the reader but also discussing major events in Haiti’s history that would help give more background knowledge of what was happening in the country when these issues were occurring. The only information I thought this graphic was lacking was a section where I could get into more details about the detrimental impacts of deforestation in general, so I was able to fill the empty space to the right of the graphic with a sidebar with more indepth information on why cutting down trees is unsustainable.

I am pretty happy with how the overall graphic turned out. My information is strong, and I think I’ve made a usually misunderstood issue clear to the reader. This was my main goal. I think the color scheme goes well with the theme, and the 3D graphic is effective and strong. The timeline style works well with the overall imagine, and integrates other background information in nicely. Looking at it now, I do feel like its feels a little text heavy. I think the ratio of text to visual imagery is heavier on the text side, so I wish I had thought of ways to incorporate more images into it. Maybe icons for the timeline? Or side bar? Thoughts..

Overall, I think I accomplished my goal of communicating a complex issue in a true way, shedding light on how historical events had led to Haiti’s current state of poverty and environmental degradation.


Map: Björk calls for action to defend Iceland’s highlands from irreversible development

iceland map

For this graphic, I originally brainstormed about geographic locations that were pertained interest to me lately. First, I thought about my recent focus on Haiti and tried to come up with an image that would convey timely information. Nothing came to mind. So instead I progressed to thinking about Iceland, since my travels there this summer made me aware how volatile their environment is with its location poised between the two continental rifts. I looked up Iceland environment on Google News and learned about the press conference had just occurred for the article I was reading. I looked up this grassroots organizational efforts to communicate this timeframe for Icelanders to sign a petition against the construction of power lines cutting straight through the heart of this island country. Instead, Bjork and Icelandic poet, Andri Snær,proposed that a better use of this untouched wilderness than pumping the land of its productivity like every other worn out piece of land would be to preserve this area for future generations as a national park.

To communicate a visual that expressed the detrimental environmental impact of this project, I used a detailed map for reference of the Icelandic Highlands to create the base Iceland vs highlands map. I then overlaid the map I found through Gætum garðsins (or “Protect the Parks”) Facebook page onto my map. I combined the two because the map that Protect the Parks used was less detailed, and seemed to have been thrown together more quickly in means of trying to just get the information out to the public. Since I had a more time, I was able to accurately highlight the highlands in real geographic perspective. It was pretty simple to scale the Protect the Parks map outline with the outline of Iceland. Next, I traced the power lines and potential power plant construction sites onto my combined map. I had a couple of routes I could have taken with this, because I found several different maps that communicated general aerial perspectives of where development would occur on the main Protect the Parks website. However, both gave me conflicting data points for locations of proposed projects. I decided to stick with the one with the power lines and roads shown. The other one was close to accurate, but just off on each point enough to make me believe that someone with less mapping experience put together these maps. While listening to the press conference, the topic of hiring professional cartographers was discussed so I assume as time goes on, more accurate maps will be available.

I think that my map would be more useful in an article to an audience outside of Iceland. They would know where their country is in relation to others. Also, native Icelanders would be aware of where there highlands are I’d assume since its such a small country, and the population is very much centered around main city hubs. I wish I would have included city names, or at the very least the capital, Reykjavik. I don’t know how useful it would be to list other major cities for an international audience. The capital, for sure. I forgot to right the label on the city. Another aspect to communicate more information would have been to highlight cities, and use circles to show the ratio of people living in each vicinity. I would estimate that this would show the low population of the highlands. This would support the fact that this development really is encroaching on untouched land, wild nature.

I never got a response from the administrator of the website to use their photos, so I updated with creative commons photos for the “What’s at stake?” side panel. I also edited this section again to repeat the circle pattern I used on the left of map as a key. With colors, I tried to create a glow around the island in the main map. Printed it came out well, if not a little strong, but for some reason it’s still not appearing in the .ai file or any on screen version of the file.

I have struggled with keeping my stories really timely/relevant, so I was proud that I found something so pressing and important now to understand before decisions are made. Even the little pull out I have from the inset is timely, within a few weeks, of the UK making a deal to create a pipeline to siphon energy from the volcanoes’ energy. The only thing I mainly wish went differently during research was that I found more data references because I mainly referenced other press releases, articles, and the young website created quickly.

Deforestation in Haiti

Graphic

Click the image to see the full graphic.

For our first project, I wanted to do some research on how dire the deforestation problem in Haiti has become in the last 20 years. It was pretty difficult to find raw data on tree cover. I luckily found a website that focuses on global deforestation. Even though some of the most recent stats only came from 2010, I still think it did a good job of displaying the continual and detrimental decline of net forest cover.

I was pretty happy with the aesthetics of the graphic. I thought the style and colors fit with the theme. I wish I could have given more current relevance to this story, but it’s something I think we should know about. Haiti could be an example of what happens when we continuously cut down our forests.

I tried giving an understanding of the long term impacts that deforestation would have on a country, especially in pullouts to further explain graphics.