
Click to enlarge!
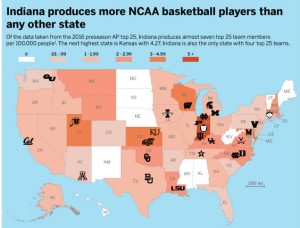
Indiana has always been known as a basketball state, and I wanted to prove that to be accurate with this graphic. I wanted to create a graphic that showed how many basketball players each state produced. I would have loved to have collected data from all Division I NCAA basketball teams, but time did not allow it. I instead chose to take data from only the AP Top 25 teams. When I collected the data I found that Indiana did produce the most basketball players, second to only California, but California also had a much higher population, which I adjusted for in the top graphic.
Overall, I’m very happy with the way that my graphic turned out. I chose orange as my main color because it is the color of a basketball. I also chose to include the locations of each Top 25 team because those locations definitely have an impact on where players are coming from. I was worried that it would make the map look too busy, but I also think it was necessary to include the information. I also chose to include smaller graphics showing the raw un-adjusted data and where each Indiana player was from to add more context. One of the major ways I think I could have improved my graphic would be by simply collecting more data. Perhaps either data from every team, or data from multiple years would have been beneficial, but doing so would have also made it more complicated.