Deforestation in Haiti

Graphic

Click the image to see the full graphic.

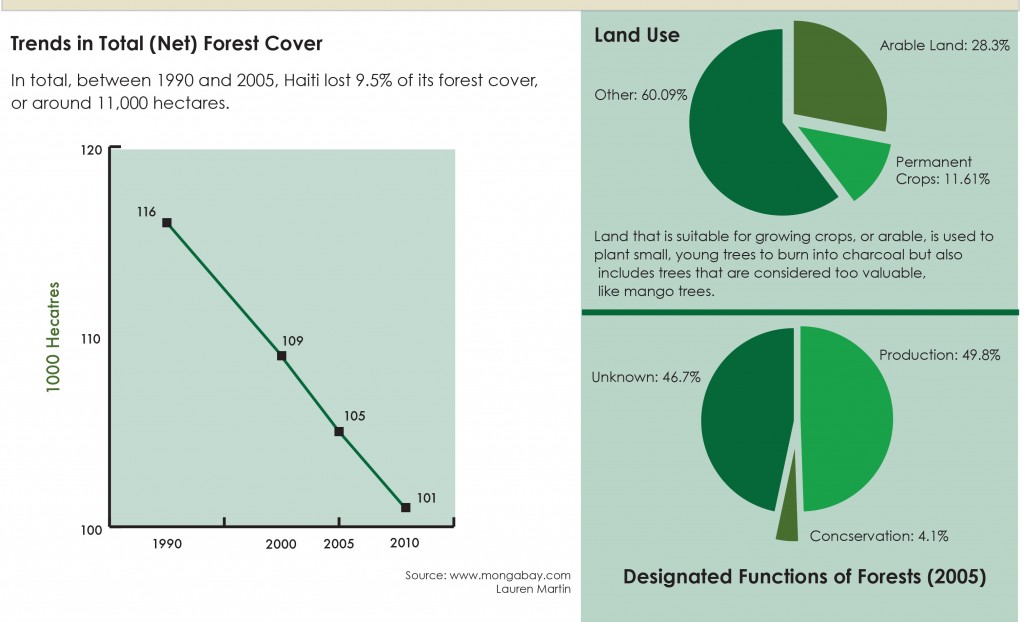
For our first project, I wanted to do some research on how dire the deforestation problem in Haiti has become in the last 20 years. It was pretty difficult to find raw data on tree cover. I luckily found a website that focuses on global deforestation. Even though some of the most recent stats only came from 2010, I still think it did a good job of displaying the continual and detrimental decline of net forest cover.

I was pretty happy with the aesthetics of the graphic. I thought the style and colors fit with the theme. I wish I could have given more current relevance to this story, but it’s something I think we should know about. Haiti could be an example of what happens when we continuously cut down our forests.

I tried giving an understanding of the long term impacts that deforestation would have on a country, especially in pullouts to further explain graphics.

Vinyl gets its groove back

Chart on vinyl revival

Click on the image to see the full graphic.

A few years ago, I started collecting vinyl records, and recently it seemed like a lot more people were starting to, as well. I wanted to see if that was just something I was experiencing, or if there really was a growing trend, and if so, by how much. For data on this topic, I looked to Nielsen Music Reports of the past several years, and found that there was in fact, an increase in vinyl sales. Not only that, but it was a significantly large one.

To present this data, I knew I wanted to utilize the circular shape of a vinyl record somehow, but that took some time to figure out. I ended up creating a bar chart and then using the arc tool to curve it into a half circle. The other charts I made were for the most part, pretty straightforward.

Overall, I’m happy with how my chart package turned out. I think my main graphic turned out cool and that the other three charts support it well.

Coach Crean’s history with IU basketball

Charts on Indiana University basketball

Click the image to enlarge the graphic.

With basketball season approaching there has been a lot of talk about coach Crean and Indiana University’s mens basketball team and how they will perform this season. For my graphic I used three charts, one showing IU’s overall record since Crean has been IU’s coach. My second graphic was the winning percentage of IU since Tom Crean has been our coach, and my final graphic was comparing his percentage of wins at Marquette and Indiana.

The final chart is slightly problematic due to the fact that Marquette is in a smaller conference and not as strong as a basketball conference. I thought the information was still relevant though because IU and Marquette had similar trends with Crean’s coaching, except IU’s wins fell the last few seasons.

The one chart I wish I could have included in this graphic was one showing player retention or the amount of times players got in trouble. The reason I didn’t do this was because it was challenging to find this information. If I would have had more time I would have researched this. I already had to create my data from scratch which was very time intensive. If there were ready-made spreadsheets for this data I would have been inclined to do the extra research for the player retention.

I used IU’s cream and crimson for my colors and navy blue to represent Marquette because their colors are gold and dark blue.

Essay internet business for globe instructions to sum up of school of carolina

Essay internet business for globe instructions to sum up of school of carolina

The essay is efficacious for everyone also, the universities which you’re putting. Those which imagine the application form as portions about the puzzle or as unbiased sounds arriving with each other to tell your tale, the essay really is a element of this challenge at least which you’ve grown full influence. Continue reading

Schreibbüro Durchsicht von Fallstudie Schreibunternehmen für Studienanfängern

Schreibbüro Durchsicht von Fallstudie Schreibunternehmen für Studienanfängern

Brauchen Sie starken medizinische Bachelorarbeit Autor für der Präparation Ihrer Hausarbeit von Anfang bis Ende.

Unsere Seite – Völlige naturwissenschaftliche Facharbeit Schaffung Online- Schreibunternehmung

Kritik Aufbereitung online Schreibgeschäfte als Unsere Seite sind beste Chance für Schulanfängern, die ebene und vertrauenswürdige Bezuschussung mit aufreibender qualitativen Aufbereitung bedürfen. Continue reading

IU increases diversity

Charts on the diversity of IU campus

Chart package on diversity change on IU campuses since 2000

I decided to make a chart package on the diversity in IU for several reasons. First of all, I am an international students and this topic is closely related to my life. Secondly, I did notice that the number of international students hugely increases compared to four years ago when I came to IU. Lastly, it seems that no one ever made a chart package on this topic before. Therefore I think that it is a good topic for my assignment.

It took me quite a while to find data. IU does have enrollment reports each term. But they are separate report, meaning that I have to put all the data from each year together by myself. Moreover, IU does not provide enrollment records that are prior to 2000 to public, which means that I cannot make graphics that I really want. That is, to show the trend from the year IU was founded to now.

However, I know this is a problem that every infographic designer may come across—sometimes you just can’t find data that you need. Anyway I decided to use the data that I got to make graphics. I compared the 2000 data to the 2015 data and show the change. Fortunately, it turned out well.

I chose and red as the main color for my graphics because it representing IU. I use dark grey and deep grey to replace white because I already have white as my background color. Overall, I am satisfied with what I did so far. It was a very fun experience.

College graduates do find jobs

Charts on employment based on education

Click on the image to see the full graphic.

My topic was unemployment and employment rates for people who are 25 and over based on their education levels. I thought this would be relevant right now because seniors who are graduating early are or should have already started looking for a job after graduation. The data I found from the Bureau of Labor Statistics shows that people who have a college education of some sort have a much higher chance of finding a job compared to others who have less education.

College students have been hearing that jobs are limited for the past few years, but as research from this past year shows, college graduates do find jobs. Whether their jobs are in the desired field or not, it does not specify. It only states whether or not the college graduate is employed.

I thought this project was a good summary of all the skills we have learned so far this semester. It was a challenge to put all of what I learned into one graphic, but I believe I accomplished that for my first at home project. The only problem I had was finding data that fit my topic and would be relevant if I attached it to the final graphic. The Bureau of Labor Statistics had a lot of valuable information that I wanted to incorporate, but after looking at my graphic carefully, I realized that the information was not relevant to the topic I was trying to address.

Tips on Producing an Examination Paper

Have you been struggling to write a great argumentative essay or dissertation? Suitably, there are diverse advantages for an individual’s malfunction nevertheless the most familiar what almost all the young people fall within the simple trap to do with is truly after inaccurate argumentative dissertation layout. The point for the subject is that click here to visit the majority high school students really don’t follow any individual program rrn any way written down a good paper. The reason for this information is to say or even a complex relating to the argumentative essay or dissertation type so as learners will most certainly be well-informed and then well-equipped to make these types of kind of articles. Continue reading