Map: Björk calls for action to defend Iceland’s highlands from irreversible development

iceland map

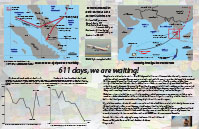
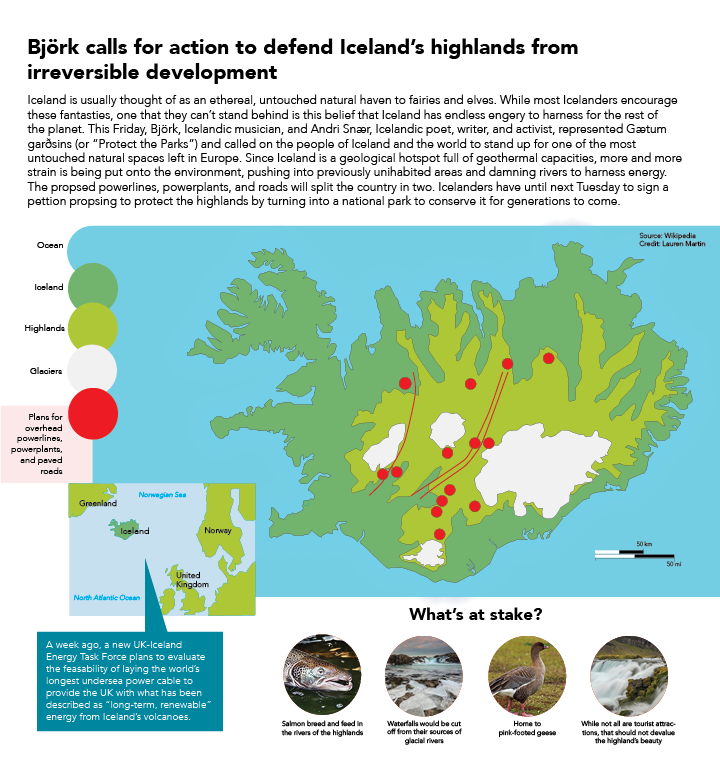
For this graphic, I originally brainstormed about geographic locations that were pertained interest to me lately. First, I thought about my recent focus on Haiti and tried to come up with an image that would convey timely information. Nothing came to mind. So instead I progressed to thinking about Iceland, since my travels there this summer made me aware how volatile their environment is with its location poised between the two continental rifts. I looked up Iceland environment on Google News and learned about the press conference had just occurred for the article I was reading. I looked up this grassroots organizational efforts to communicate this timeframe for Icelanders to sign a petition against the construction of power lines cutting straight through the heart of this island country. Instead, Bjork and Icelandic poet, Andri Snær,proposed that a better use of this untouched wilderness than pumping the land of its productivity like every other worn out piece of land would be to preserve this area for future generations as a national park.

To communicate a visual that expressed the detrimental environmental impact of this project, I used a detailed map for reference of the Icelandic Highlands to create the base Iceland vs highlands map. I then overlaid the map I found through Gætum garðsins (or “Protect the Parks”) Facebook page onto my map. I combined the two because the map that Protect the Parks used was less detailed, and seemed to have been thrown together more quickly in means of trying to just get the information out to the public. Since I had a more time, I was able to accurately highlight the highlands in real geographic perspective. It was pretty simple to scale the Protect the Parks map outline with the outline of Iceland. Next, I traced the power lines and potential power plant construction sites onto my combined map. I had a couple of routes I could have taken with this, because I found several different maps that communicated general aerial perspectives of where development would occur on the main Protect the Parks website. However, both gave me conflicting data points for locations of proposed projects. I decided to stick with the one with the power lines and roads shown. The other one was close to accurate, but just off on each point enough to make me believe that someone with less mapping experience put together these maps. While listening to the press conference, the topic of hiring professional cartographers was discussed so I assume as time goes on, more accurate maps will be available.

I think that my map would be more useful in an article to an audience outside of Iceland. They would know where their country is in relation to others. Also, native Icelanders would be aware of where there highlands are I’d assume since its such a small country, and the population is very much centered around main city hubs. I wish I would have included city names, or at the very least the capital, Reykjavik. I don’t know how useful it would be to list other major cities for an international audience. The capital, for sure. I forgot to right the label on the city. Another aspect to communicate more information would have been to highlight cities, and use circles to show the ratio of people living in each vicinity. I would estimate that this would show the low population of the highlands. This would support the fact that this development really is encroaching on untouched land, wild nature.

I never got a response from the administrator of the website to use their photos, so I updated with creative commons photos for the “What’s at stake?” side panel. I also edited this section again to repeat the circle pattern I used on the left of map as a key. With colors, I tried to create a glow around the island in the main map. Printed it came out well, if not a little strong, but for some reason it’s still not appearing in the .ai file or any on screen version of the file.

I have struggled with keeping my stories really timely/relevant, so I was proud that I found something so pressing and important now to understand before decisions are made. Even the little pull out I have from the inset is timely, within a few weeks, of the UK making a deal to create a pipeline to siphon energy from the volcanoes’ energy. The only thing I mainly wish went differently during research was that I found more data references because I mainly referenced other press releases, articles, and the young website created quickly.

Map of NY,NY vs. SF,CA for Cost of Living

Hi! This is my graphic set for the Map project!

I decided to compare cost of living in San Francisco and New York City, because I was curious how they stacked up– I had read several articles over the past year when looking into places I might want to work after graduation, and it seemed to be a toss-up which one people claimed was more expensive. I chose to focus on Manhattan within NYC, because this contains the most stereotypical and prototypically-imagined NYC experience.

I based this graphic set off of census numbers, as data from a few other sources. One source, richblockspoorblocks.com proved to have some really interesting data visualization of income numbers based off of the 2013 census, so they were a huge asset– unfortunatly, they charged for a person to use their site for more than a few searches, limiting their helpfulness. Numbeo was useful in providing percentage stack ups by category, based on data in the same census.

When evaluating my final pictured version of this map pack compared to the first version of this graphic (not pictured, for your own good– it was very bad), it is safe to say my final graphic is a solid representation of the data I found. There is obviously room for improvement, especially as this class does not come naturally to me, but I am for the most part immensely proud of what I eventually produced.

Room to Improve:
I could have added more data labels and better call-outs to label cities or landmarks. I tried to do this, but struggled to integrate it without overpowering the other data, so I ended up getting rid of it. If I did a next version of this, that would be what I would strive to find a way to add, to improve the usefulness of the graphic. This considered, I still feel my graphic accomplishes a lot without these labels– thus why I ended up turning it in as-is.

Things I Did Well: 
I like my color scheme– It feels very in character and earth-toned. I like my choice to omit water, as it makes it feel cleaner and more modern to me this way (in keeping with the newer flat design styles I see around). I like my key and how I displayed it with circles, and I am really proud of my chosen data displaying method for the bottom 3 graphics, where I made the illustrative objects myself, to provide quick meaning and contribute additional depth to my graphic. I like the way I demonstrated percentage difference in these same images, using scaling and a green bar only measuring change in height to clarify this is the only scaling I am trying to use (as opposed to percentage of the whole object– I chose to use just height scaling as a form of measurement in change, that is). I also was proud of my proportional symbol map to show NYC vs. SF population on the reference map.

I hope you like it! (It took a LOT of hours to make).

This is my graphic pack for the map project! I wanted to compare cost of living for NY, NY and SF, CA.

This is my graphic pack for the map project! I wanted to compare cost of living for NY, NY and SF, CA.

map_lent final

Kevin Wilson’s Recruiting Pipeline

Enlarge to see full graphic

Enlarge to see full graphic

For my map project, I decided to dissect IU football head coach Kevin Wilson’s recruiting trends across the United States. Wilson has struggled in the Big Ten conference during his time at IU, so I thought it would be interesting to see if it has anything to do with where he recruits his players.

He took over the football team in 2011, immediately beginning recruiting for the 2012 class. For this project I compiled his recruiting classes from 2012 to his latest in 2015, using the database on 247sports. During my research I found he gets most players in-state, but also recruits heavily in Georgia and Florida.

When I was growing up, I was obsessed with recruiting players in the NCAA Football video games. The game would highlight the states where you get the most recruits for your team, so I used that as inspiration. The term “pipeline” is used in this game and among college football analysts to describe where a university gets its players, and I decided to keep this in mind while working on my map project.

One of the hardest things to sort out was players recruited out of junior college. Four players were from junior colleges in Iowa, but I ended up finding where these JUCOs were originally went to high school. I also had to cross-reference with the final team rosters at IU Athletics to make sure Wilson’s recruits made it to school. Some players never reported to camp due to academic or personal reasons, so I omitted them from the final data set.

By the end of this project, I learned the importance of distinct-but-related color schemes. It was challenging to figure out what shades of red to color the states based on the number of recruits. But after it was all said and done, this project ended up being fun to work on.


Endangered orangutans found only in Southeast Asia

MAP_Meert

My map project was about endangered orangutans in Southeast Asia. My research showed that the only place where these endangered orangutans live are in the Indonesian islands of Sumatra and Borneo.

This project was very beneficial because it helped my drawing skills in Illustrator. I had never drawn in Illustrator before this class, and with this project, I was able to practice and perfect how to use the drawing tool.

The only problem I had when I was doing this project, is when I was finished drawing, I felt my graphic was very boring. I wished I had picked a more detailed graph that was more visually appealing. I tried to find data on the subject instead of just having maps, but I couldn’t find enough to do anything with it.

This problem will help me on the final project because it will make me think harder on my final topic so I won’t run into the same problem again.

Correlation between abstinence-only sex education and teen pregnancy rates

Click on the image to see the full graphic.

For this project, I really struggled to settle on a topic. I considered a lot of different ideas, but had a difficult time finding data for them that would translate into a map. That being said, when I found a substantial amount of data for state teen pregnancy rates and types of sex education, I was ecstatic (and relieved).

There was a lot of data to sift through, but I ended up choosing to use information on teen pregnancy rates by state, global teen pregnancy rates, states that stress abstinence-only sex education and the outcomes of teen pregnancy.

The main graphic is a chloropleth of the United States showing the ranges of teen pregnancy rates across the country. Drawing the map took longer than anticipated, but it was manageable. In addition to shading the states corresponding to its pregnancy rate, I also used black dots to indicate which stressed abstinence in their sex education. I don’t know if I’m 100 percent happy with the way I chose to make that distinction, but I think it gets the point across. In addition to that, I charted the pregnancy rates of a few countries I could find to show just how high the U.S.’s was in comparison.

I think this is a really important issue, and seeing it displayed visually makes it clear that sex education in the U.S. needs to be restructured.

611 days, we are waiting!

Click to view

target=”_blank” Click to view

http://www.j464.net/f15/wp-content/uploads/2015/11/Map_Xia.pdf

Recently, a Russian plane crashed in the Egypt reminded me of the missing MH 370. Also, though this accident has passed over a year, there are still lots of follow-up reports in China, which document grief of people who lost their family member(s). Also, in the past summer, there were new evidences, which light hope to people again, were found at Reunion Islands. Looking at the MH17 accident and the one in the Egypt, technological failure seems not a major issue for civilian aircraft accident as it was at last few decades. Instead, terrorism and military conflicts are more likely to kill innocent people at thousand feet height. There were not many civilian aircraft disappearances with the strong background of conspiracy theory in the contemporary history. We are the witness of this one, and I am looking forward to see what the final result of this accident is.

I found this data is worth to demonstrate because all I knew was the plane is missing. But I didn’t know information in such a detailed way, including known flight path, ocean current influence, and search areas. This assignment is a self-learning process, which not only about knowledge, but also demonstrates information in an artistic and effective way. From specific to general, I want to see, with technological improvement, is there any correlation between death rate and crash rate over years.

It is a pretty interesting assignment overall. I never thought I would able to do this kind of chart that I only saw in the news before. I re-draw the map couple times, which was kind of frustrated, but it is fun to figure out how to operate by myself through fails. Tutorials online also enhances my perception on map making greatly.

Indiana Basketball

MAP_GRINER

Click to enlarge!

Indiana has always been known as a basketball state, and I wanted to prove that to be accurate with this graphic. I wanted to create a graphic that showed how many basketball players each state produced. I would have loved to have collected data from all Division I NCAA basketball teams, but time did not allow it. I instead chose to take data from only the AP Top 25 teams. When I collected the data I found that Indiana did produce the most basketball players, second to only California, but California also had a much higher population, which I adjusted for in the top graphic.

Overall, I’m very happy with the way that my graphic turned out. I chose orange as my main color because it is the color of a basketball. I also chose to include the locations of each Top 25 team because those locations definitely have an impact on where players are coming from. I was worried that it would make the map look too busy, but I also think it was necessary to include the information. I also chose to include smaller graphics showing the raw un-adjusted data and where each Indiana player was from to add more context. One of the major ways I think I could have improved my graphic would be by simply collecting more data. Perhaps either data from every team, or data from multiple years would have been beneficial, but doing so would have also made it more complicated.

Attractions people love most in Yellowstone National Park

Map chart of top attractions in Yellowstone National Park

Click on the image for a PDF version of my graphic

Yellowstone National Park is one of the most famous parks in the world. It attracts thousands of people to visit every year. However, there are so many attractions in the park that many people have no idea which one to visit. My goal for this project is to create a map chart that can clearly tell people what top ten attractions are and where they located in the park.

It took me some time to look for data. There are so many different data of what the top ten attractions are. However, I decided to use the data from Yellowstone Net, one of the most authorized websites for Yellowstone National Park.

There are many map graphs for Yellowstone National Park already. However, most of them are too complicated and hard to read. Therefore I decided make a map that only includes important elements of the park and make it easy to understand. I chose blue color for lakes and brown color for land of the park in order to match people’s common perception of how they look. I tried white color for roads first but it did not show very well on my light brown color land. Therefore I changed the color of roads to yellow. I followed our J464 style guide to use Myriad Pro and BentonSansCond Bold* because I think they look very nice on my design.

As for the composition, I wanted to place five images of attractions on the left side and the other five on the right side – just as how people normally do.
However, I realized that there is an insert map that takes quite a lot of space on the right side of the page. Therefore I decided to place four images on the left side, and the other six images on the right side with two columns in order to balance the height of two sides.

I learned a lot from the project. I am much more comfortable with using Illustrator and pen tool now. And I am more proficient with making scale. Overall, I am satisfied with my design. But there are still some things that I want to do but I did not know how to do it, such as creating texture. I believe that I can make it nicer after I learn more about Illustrator.

Where is the Starbucks loved the most?

Click on the image for a PDF version of my graphic

Click on the image for a PDF version of my graphic

On this project, I wanted to give big picture of where Starbucks is loved the most. Largest visual was given to the U.S. map because it is the most relevant for imaginary audiences in the U.S. Other two sub-visuals show where Starbucks is loved the most world widely; by city and country.

There is nothing specially surprising and new that I learned as I researched the topic as I already knew that Starbucks is the top coffee chain especially in the world wide view. It was not too surprising to see that Starbucks is most popular in the west side of the States as Starbucks started from San Francisco, although the top state that has most Starbucks store was the D.C. The final version did not show because it was not very relevant to the topic, but I looked at Starbucks’ annual report from 2008-2014 to have a more comprehensive view on how Starbucks is doing. The reports show that it has been expanding and growing steadily when it is already the largest coffee chain in the world. It was impressive to see the growing rate. Also, as I came from South Korea, I knew that we have A LOT of Starbucks in Seoul, but I didn’t know we had the most number of Starbucks stores in the world.

Doing this project made me to be more comfortable with Illustrator and in using pen tool. Drawing the whole US map did take much time but somehow I enjoyed it because I didn’t have to think very much to draw the map. I like what the new pen tool does. I used to have a hard time to grasp idea on how the pen tool will draw, but the new feature makes drawing much easier for me.

What I like about my work is that I could give in where Starbucks is loved and how much within the U.S. and also in the globe. I also like the structure of the charts. However, I feel like the color could be more diverse. I tried to have a color theme as Starbucks’ official color with a little bit of coffee color such as on words under the map, but using more of the brown color on the sub visual could be better.

More offenses Cobb guy claims he was almost murdered

To provide a master amateur, you’re building up then moving forward a person’s studies. Dogs with aggressive behavior is in web site, but yet you are still training as well as the improving your abilities. Any re-writing considerations for only a experienced point are as well of a better levels in addition to end aided by the shift on dissertation. The main thesis depends on a proposal To a second reasons for different types – in places you formulate an option and try to find blessing from your very own practitioners. Continue reading